Cal-Bridge scholar Tommy Wen Chin’s research highlighted in Astrobites e-zine
Published: April 21, 2021
Publication: Astrobites
Author: Tommy Wen Chin
Tommy Wen Chin is a 4th year undergraduate student at San José State University and a Cal-Bridge scholar. He conducted this research with Dr. Steven Furlanetto at UCLA as part of a Cal-Bridge REU and presented it as a poster at AAS2021.
During the epoch of reionization, ionizing photons from early galaxies carved out large ionized bubbles in the neutral intergalactic medium, which grew and eventually filled the Universe by about a billion years after the Big Bang. Over the next decade, using instruments like the Hydrogen Epoch of Reionization Array (HERA), astronomers hope to image the neutral regions remaining at the end of reionization using the 21-cm line. They hope to observe the state of the universe in this last unexplored phase of cosmic evolution to discover what objects first lit up the universe and how and when the first galaxies formed.
Unfortunately, although there are many models describing how ionized bubbles grow during reionization, there is little understanding of how the sizes of remnant neutral regions depend on astrophysical parameters, even though they are closely related problems.
We produced semi-numerical simulations of the neutral regions using 21cmFAST, which can be seen in Figure 1. We developed a Gaussian sphere method to measure the sizes of these regions and study their dependence on various astrophysical parameters. We then compared our results to other publicly available methods, specifically the mean-free-path (ray-casting) and friends-of-friends (percolation) methods. We found good agreement between these three methods at a constant overall neutral fraction, <xHI>. However, the Gaussian sphere approach is much more similar in principle to the method of HERA’s observation.

Figure 1: 21cmFAST simulations of neutral regions where the parameters Rmax and ζ are varied such that = 0.2. Rmax characterizes the length of the mean free path of ionizing photons, while ζ characterizes the number of photons produced per galaxy. Yellow represents neutral while purple represents ionized regions. We qualitatively observe that the typical neutral region size decreases as we decrease Rmax while increasing ζ to maintain = 0.2.
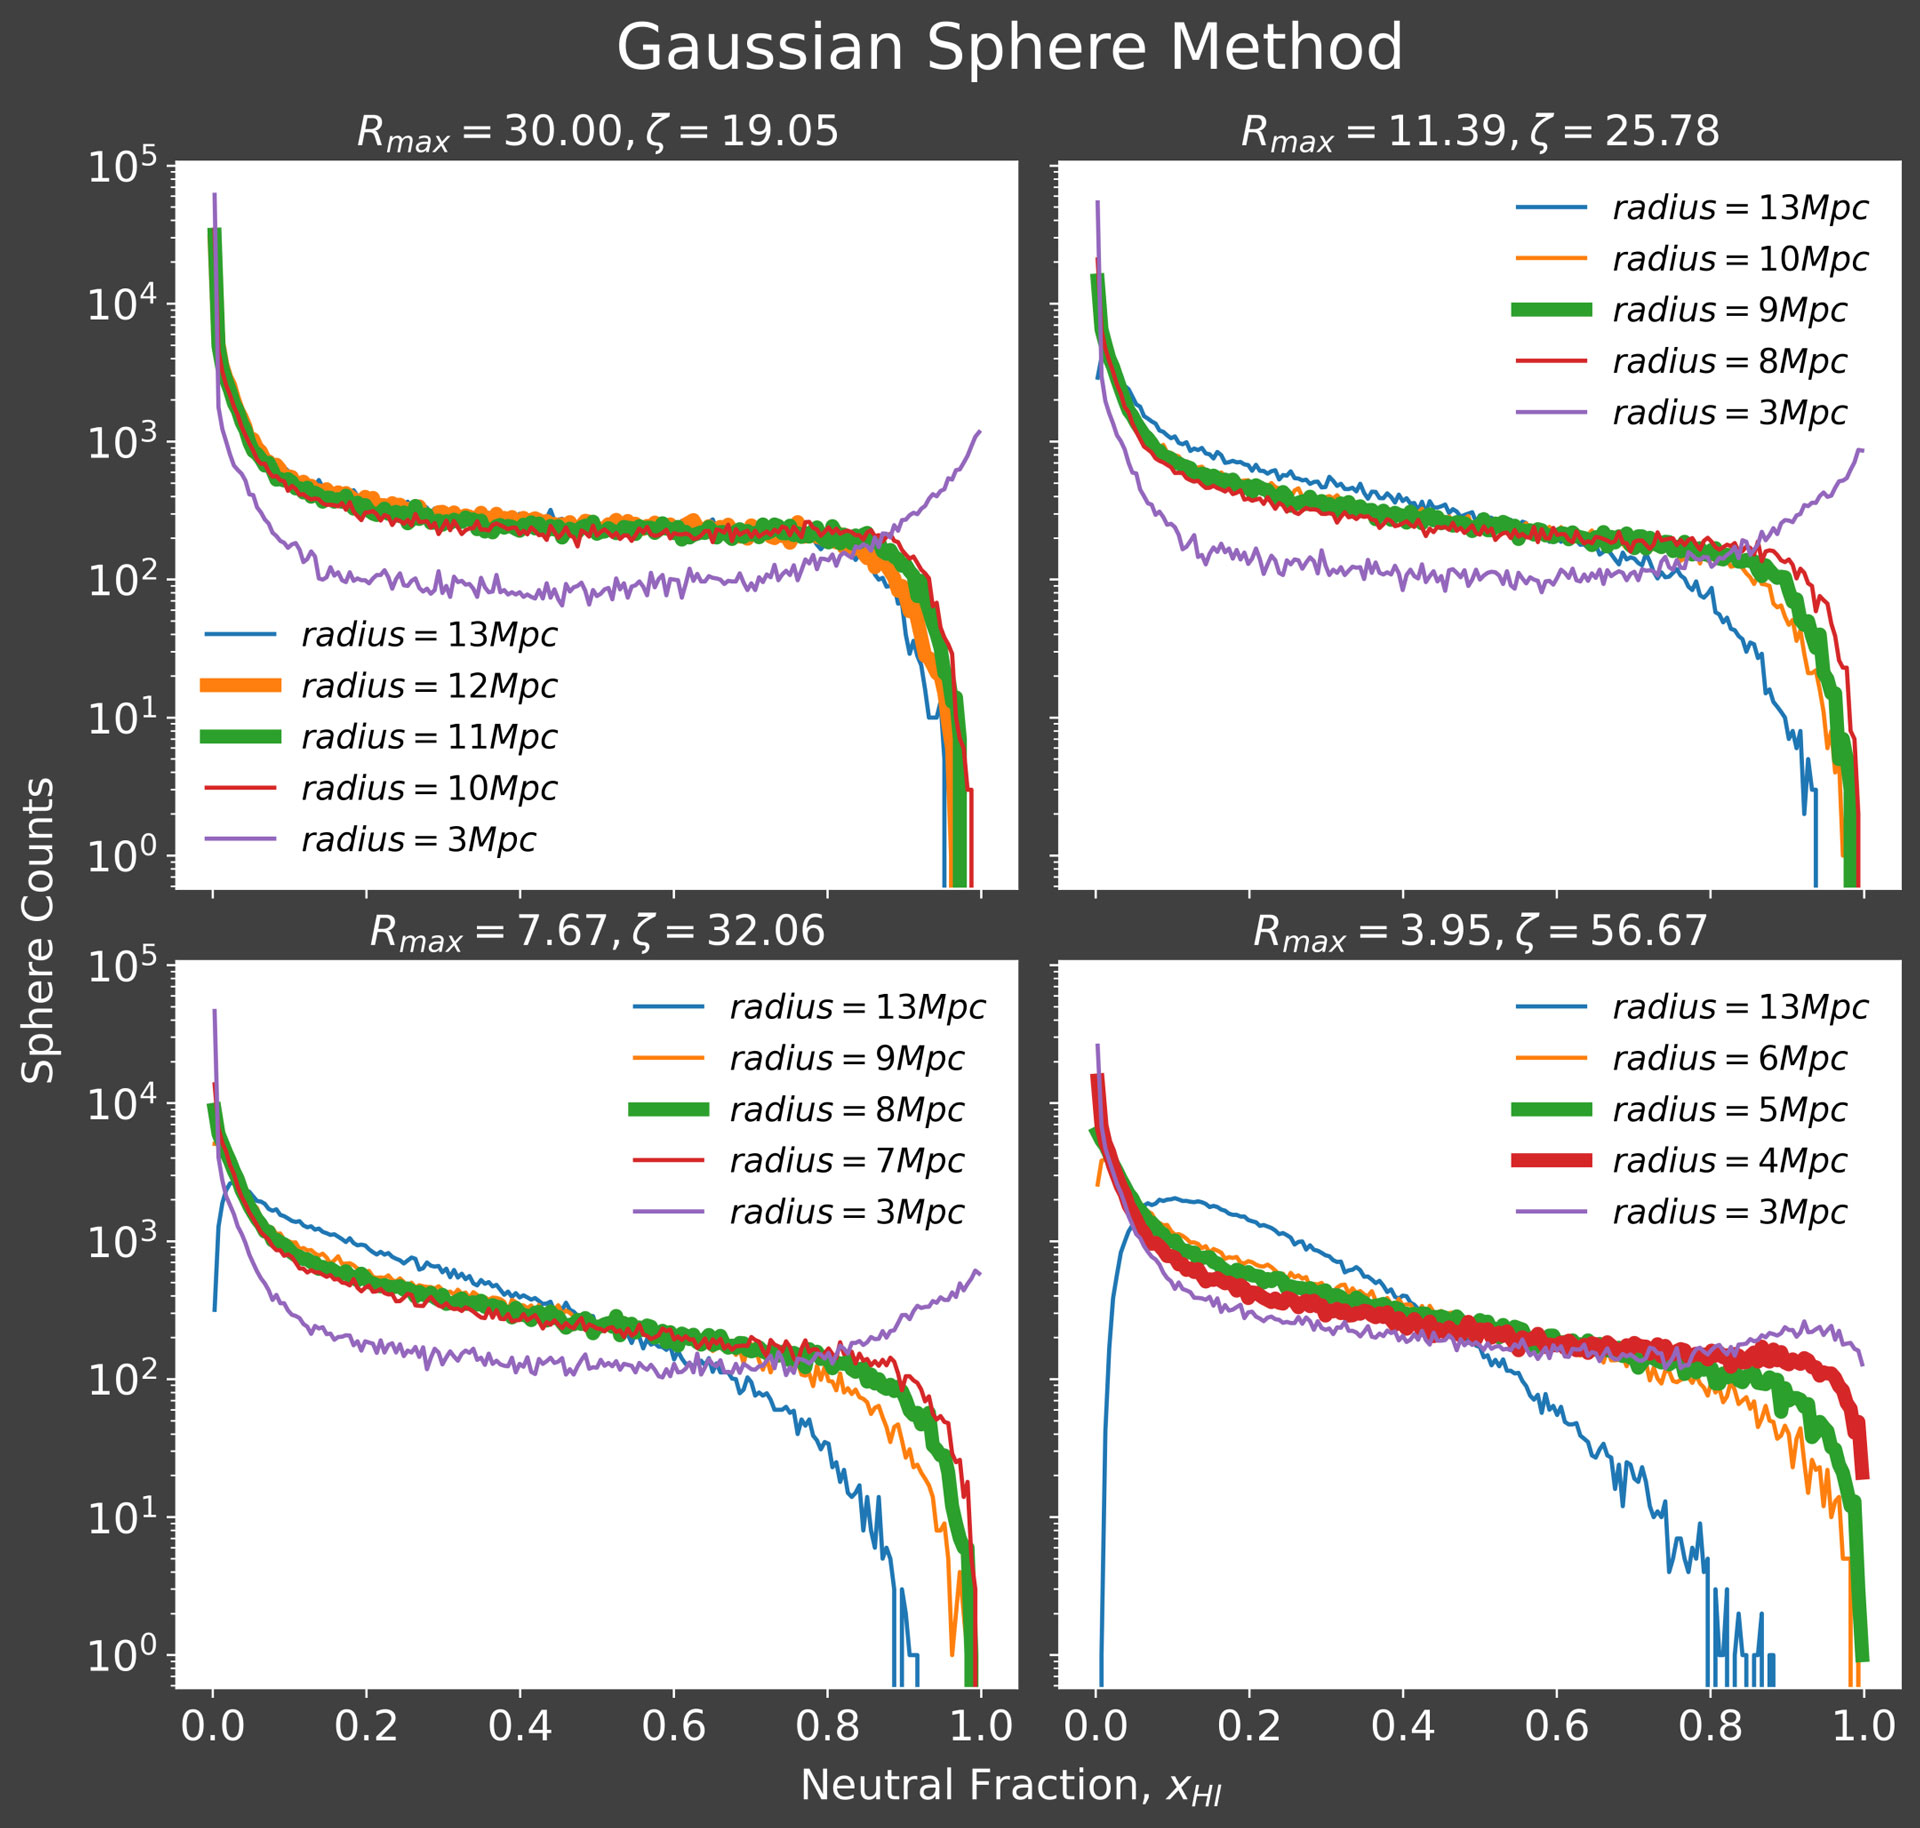
Using these methods, we explored how specific astrophysical parameters affect the neutral region sizes after controlling for <xHI>. Specifically, we investigated the overall ionizing efficiency of galaxies, ζ, and the horizon over which ionizing photons propagate, Rmax. Figure 2 shows results of the Gaussian sphere method applied to the simulation data shown in Figure 1. A previous step in the Gaussian sphere algorithm determines the characteristic curve shape that corresponds to the typical size of the neutral regions (plotted in bold in Figure 2).

Figure 2: Results of the Gaussian sphere method applied to the simulation data shown in Figure 1, where each subplot shows results for one set of the tested values of Rmax and ζ. Each colored curve represents the different sphere sizes tested, with bold curves showing the best fit to the simulated data, roughly corresponding to the typical size of the neutral regions at these parameters.


